Marbach: Property prices & Price per m²
Price per m2
Price m2 in Marbach
Apartments
Houses
Trends
Real Estate price per m2 trends in Marbach
Average prices per m2 in Marbach have changed by +7.7% over the last 12 months. The prices for flats in Marbach have changed by % over the last 3 months, by % over the last 6 months and by +8.3% over the last year. For houses, the trend is +4.7% over the past 3 months, +11.6% over the past 6 months and +7% over the past year.
Average price per m2 - trends
CHF 7'890
(min.
CHF 6'840 –
max.
CHF 8'548)
CHF 6'513
(min.
CHF 3'814 –
max.
CHF 7'602)
3 months
%
6 months
%
12 months
+8.3%
3 months
+4.7%
6 months
+11.6%
12 months
+7%
Median price
Median property prices per m2 in Marbach
Average median price m2 in Marbach
CHF 8'085
CHF 6'916
Median price per m2 by property type
Studio
Insufficient data
2 to 2.5 rooms
Insufficient data
3 to 3.5 rooms
CHF 8'524
4 to 4.5 rooms
Insufficient data
5 to 5.5 rooms
Insufficient data
6 rooms and more
CHF 7'255
1 to 2.5 rooms
Insufficient data
3 to 3.5 rooms
Insufficient data
4 to 4.5 rooms
CHF 5'374
5 to 5.5 rooms
CHF 3'814
6 to 6.5 rooms
CHF 7'309
7 rooms and more
Insufficient data
Median
CHF 8'085
CHF 6'916
- - 60% of apartments are worth between CHF 8'168 & CHF 8'548 per m²
- - The bottom 20% of apartments are worth less than CHF 8'168 per m²
- - The top 20% of apartments are worth more than CHF 8'548 per m²
- - 60% of houses are worth between CHF 6'240 & CHF 7'384 per m²
- - The bottom 20% of houses are worth less than CHF 6'240 per m²
- - The top 20% of houses are worth more than CHF 7'384 per m²
The financial experts
We are here to help
Free and non-binding phone appointment
Surrounding areas
Surrounding areas in Marbach
|
Location
|
Average price per m2 of an apartment
|
Average price per m2 of a house
|
For sale
Properties for sale in Marbach
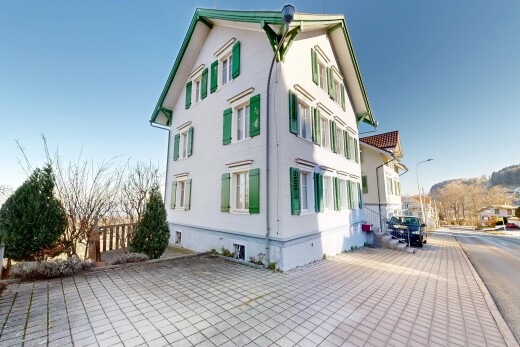
Marbach (SG): Quality of life and real estate market
As of 2020, Marbach (SG) has reported an average taxable income of CHF 66'776 per taxpayer — 15.5% below the national mean of CHF 79'015. This income level ranks the municipality 1322th out of Switzerland's 2'203 municipalities.
In 2022, a total of 7 new residential buildings were constructed in Marbach (SG), resulting in 7 additional dwellings. This equates to 3.3 new units per 1,000 residents, ranking the city 496th out of 2'203 Swiss municipalities for new housing construction per capita.
In 2024, 0.69% of dwellings in Marbach (SG) were vacant, compared to a national vacancy rate of 1.08% across Switzerland.
In 2023, Marbach (SG) recorded an average of 224.1 inhabitants per square kilometer. For comparison, the national average population density in Switzerland was 483.6 inhabitants per km² that same year. Marbach (SG) ranked 540th out of 2'203 municipalities.