Gibloux: Property prices & Price per m²
Price per m2
Price m2 in Gibloux
Apartments
Houses
Trends
Real Estate price per m2 trends in Gibloux
Average prices per m2 in Gibloux have changed by +12.9% over the last 12 months. The prices for flats in Gibloux have changed by +7.4% over the last 3 months, by +10.8% over the last 6 months and by +15.7% over the last year. For houses, the trend is +6% over the past 3 months, +8.6% over the past 6 months and +10.2% over the past year.
Average price per m2 - trends
Insufficient data
Insufficient data
3 months
+7.4%
6 months
+10.8%
12 months
+15.7%
3 months
+6%
6 months
+8.6%
12 months
+10.2%
Median price
Median property prices per m2 in Gibloux
Average median price m2 in Gibloux
Insufficient data
Insufficient data
Median price per m2 by property type
Studio
Insufficient data
2 to 2.5 rooms
Insufficient data
3 to 3.5 rooms
Insufficient data
4 to 4.5 rooms
Insufficient data
5 to 5.5 rooms
Insufficient data
6 rooms and more
Insufficient data
1 to 2.5 rooms
Insufficient data
3 to 3.5 rooms
Insufficient data
4 to 4.5 rooms
Insufficient data
5 to 5.5 rooms
Insufficient data
6 to 6.5 rooms
Insufficient data
7 rooms and more
Insufficient data
Median
CHF 0
CHF 0
The financial experts
We are here to help
Free and non-binding phone appointment
Surrounding areas
Surrounding areas in Gibloux
|
Location
|
Average price per m2 of an apartment
|
Average price per m2 of a house
|
For sale
Properties for sale in Gibloux
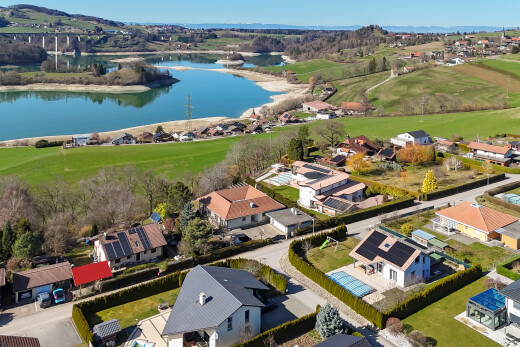
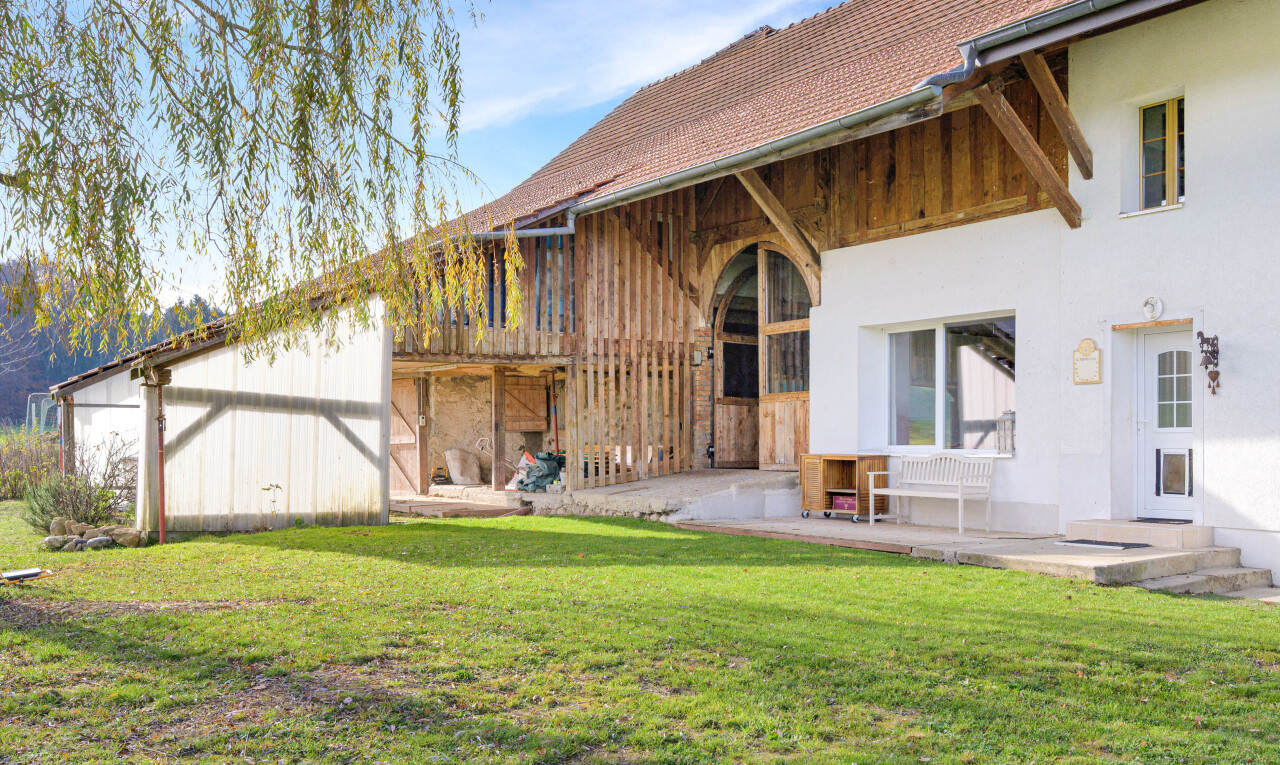
Gibloux: Quality of life and real estate market
Gibloux is made up of 12 localities: Farvagny-le-Grand (1726), Vuisternens-en-Ogoz (1696), Rossens FR (1728), Corpataux (1727), Grenilles (1726), Farvagny-le-Petit (1726), Estavayer-le-Gibloux (1695), Rueyres-St-Laurent (1695), Villarlod (1695), Posat (1726), Villarsel-le-Gibloux (1695) and Magnedens (1727).
As of 2020, Gibloux has reported an average taxable income of CHF 71'425 per taxpayer — 9.6% below the national mean of CHF 79'015. This income level ranks the municipality 953th out of Switzerland's 2'203 municipalities.
In 2022, a total of 33 new residential buildings were constructed in Gibloux, resulting in 126 additional dwellings. This equates to 15.9 new units per 1,000 residents, ranking the city 23th out of 2'203 Swiss municipalities for new housing construction per capita.
In 2024, 2.36% of dwellings in Gibloux were vacant, compared to a national vacancy rate of 1.08% across Switzerland.
In 2023, Gibloux recorded an average of 224.1 inhabitants per square kilometer. For comparison, the national average population density in Switzerland was 225.6 inhabitants per km² that same year. Gibloux ranked 964th out of 2'203 municipalities.